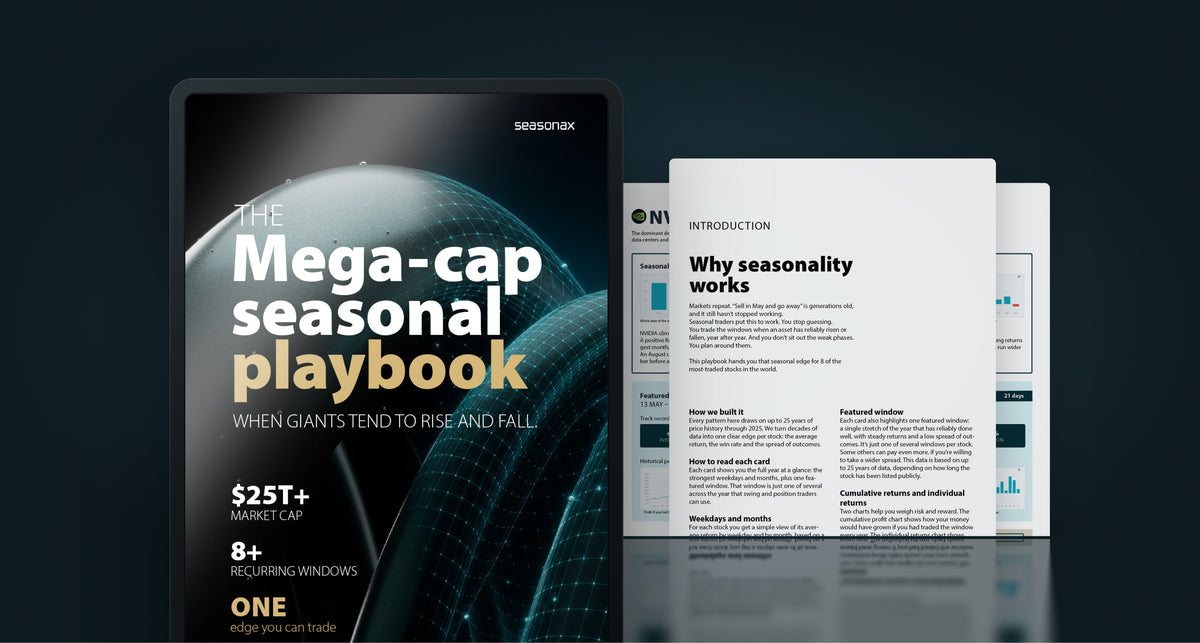
You've watched NVIDIA, Apple and the other giants explode. But even mega-caps don't climb in a straight line. This playbook shows you when they have tended to rise and fall, drawing on up to 25 years of price history through 2025.
Stock seasonality is the tendency of a stock to follow recurring calendar patterns, the same weeks and months potentially paying off year after year. We turned decades of that data into 8 clear, tradable windows.
Inside you get a one-page profile for 8 of the world's most-traded stocks: NVIDIA, Apple, Microsoft, Amazon, Alphabet, Meta, Broadcom and Taiwan Semiconductor. For each one:
- Seasonal profile with average return by weekday and by month based on 10 years of historical data
- One featured seasonal window with historical performance and risk indicators based on up to 25 years of data
- Cumulative and year-by-year charts so you can judge each window's consistency for yourself
If you trade swings or hold positions in mega-caps, this is the stock seasonality you'll want to factor in. Know what each part of the year has tended to bring and gain a statistical tailwind.
Download the playbook and see the stock seasonality behind the market's biggest names.
Educational content based on historical data. Past performance doesn't guarantee future results.